Find Your Next
Perfect Place to Live
Team Realty of Terre Haute
Our Available Properties
Rent From Team Realty!
These are properties that are either available or coming available soon.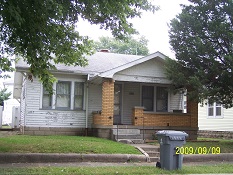
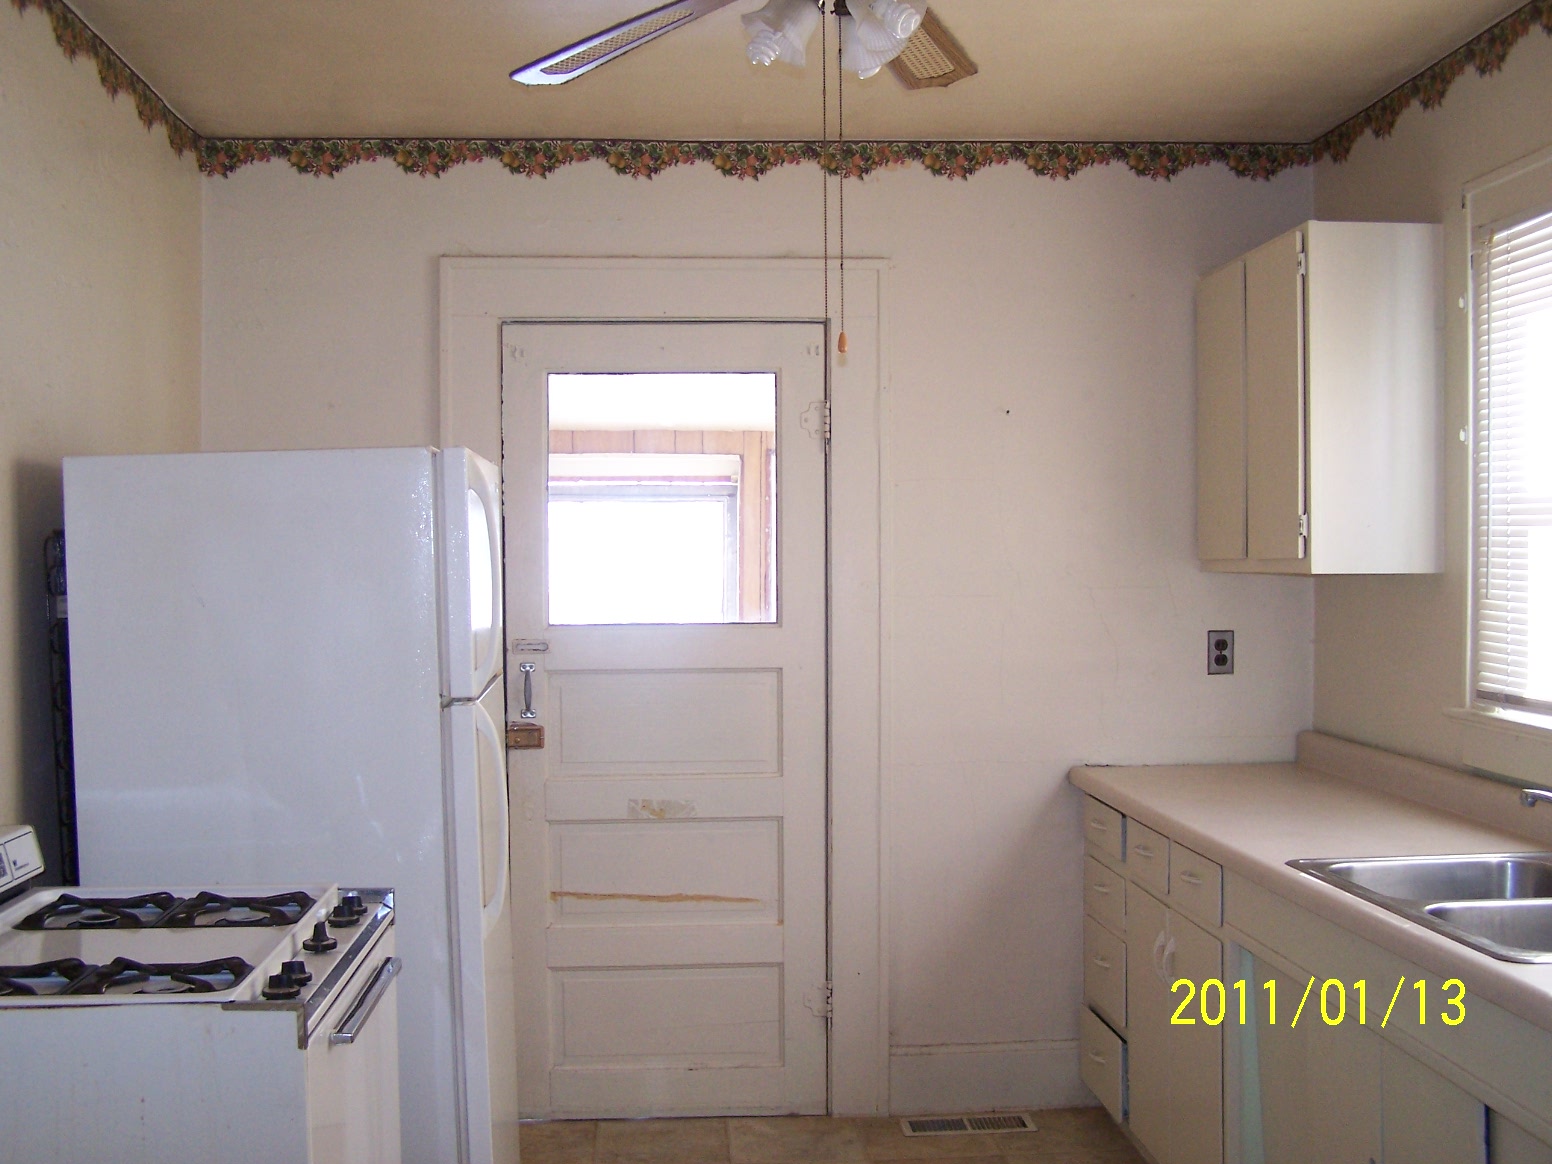
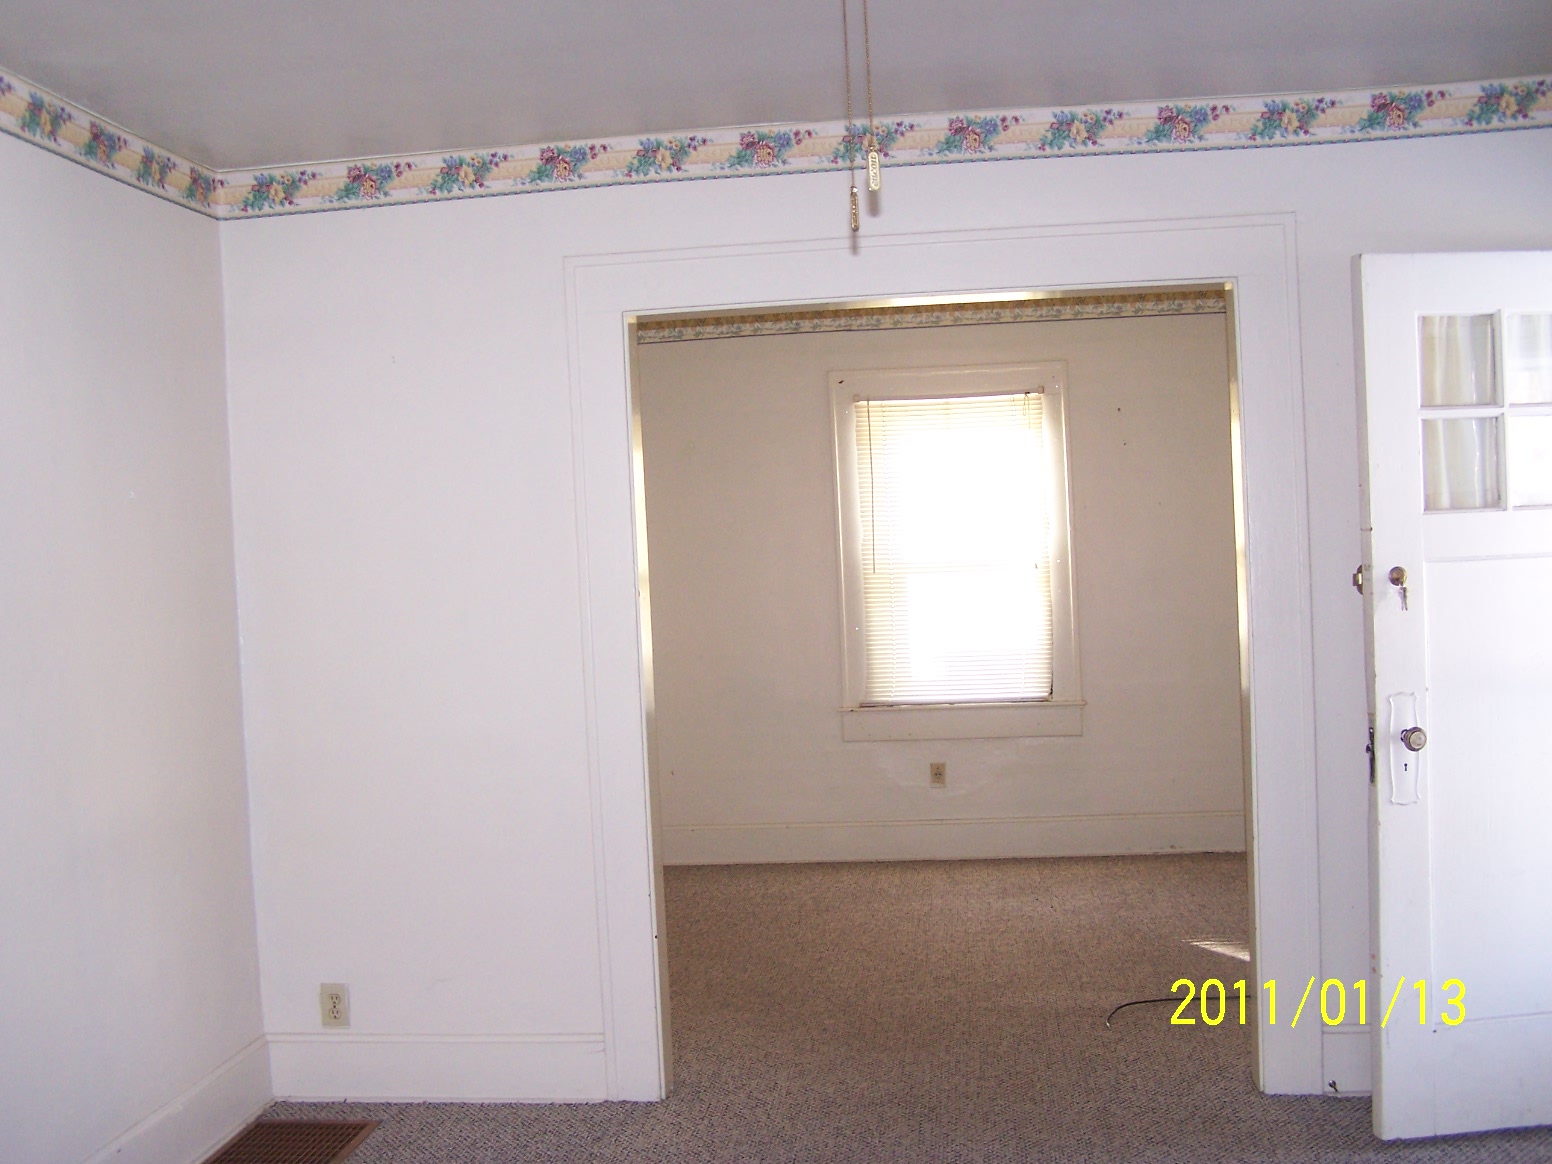
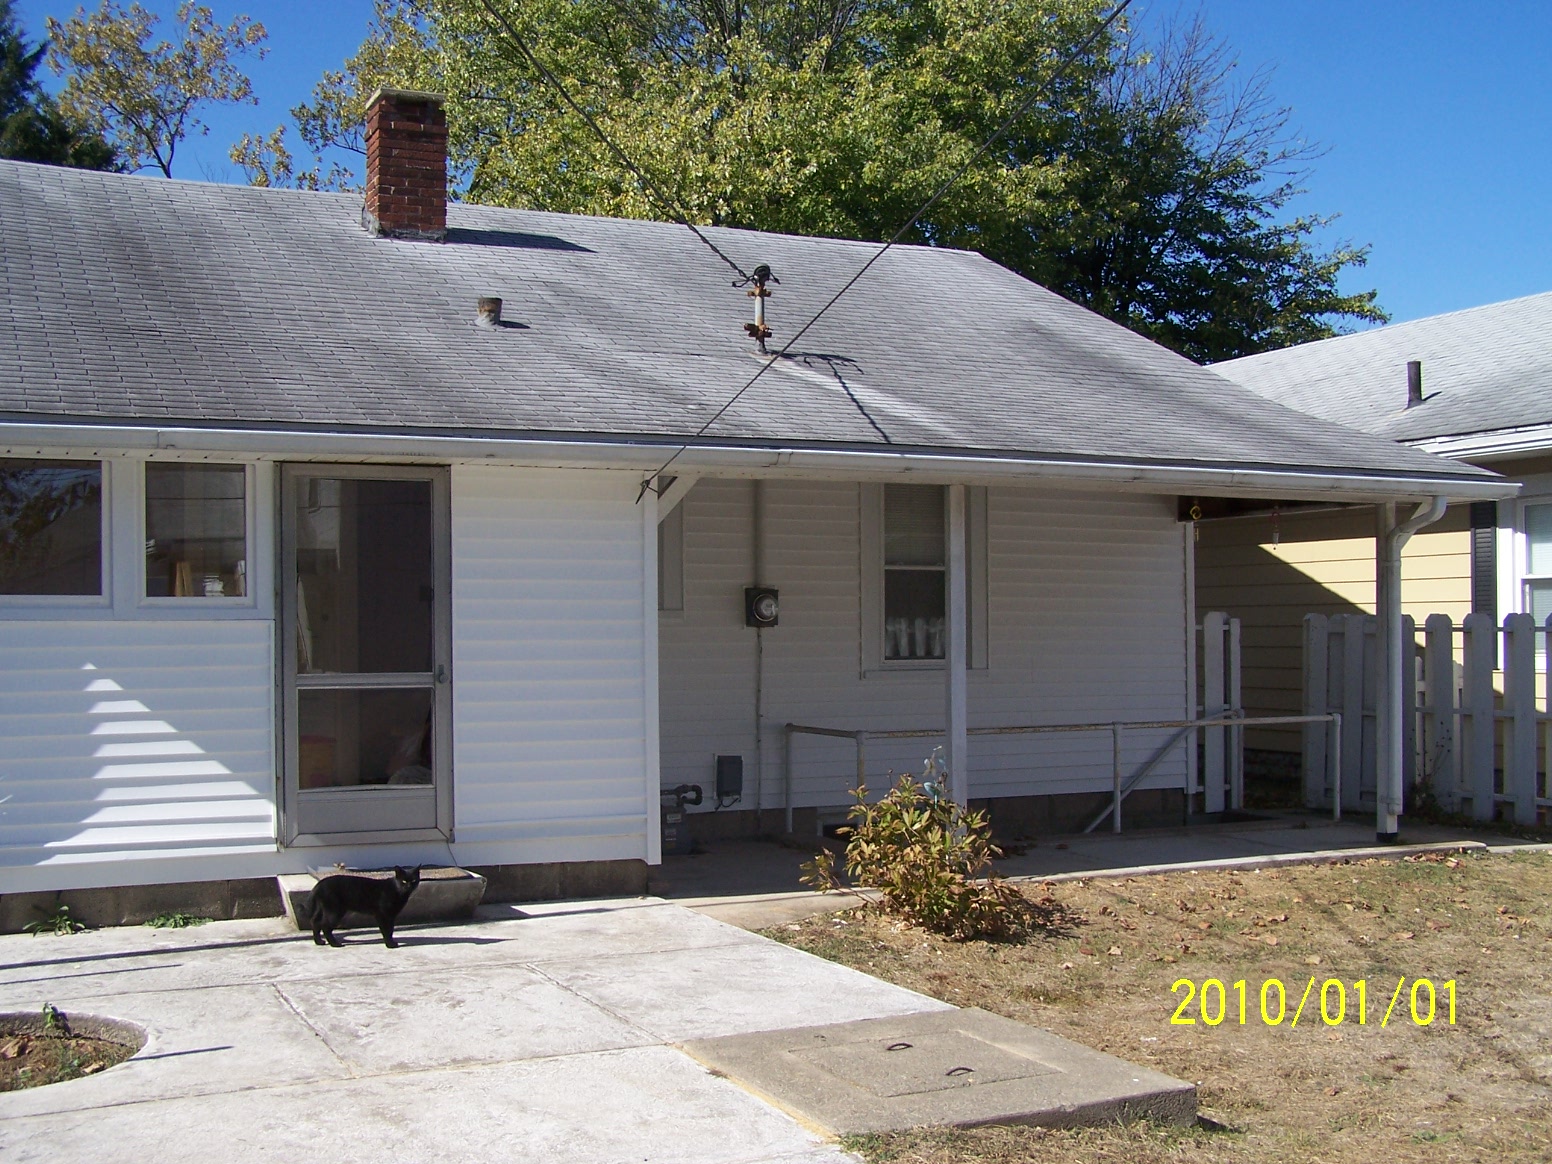
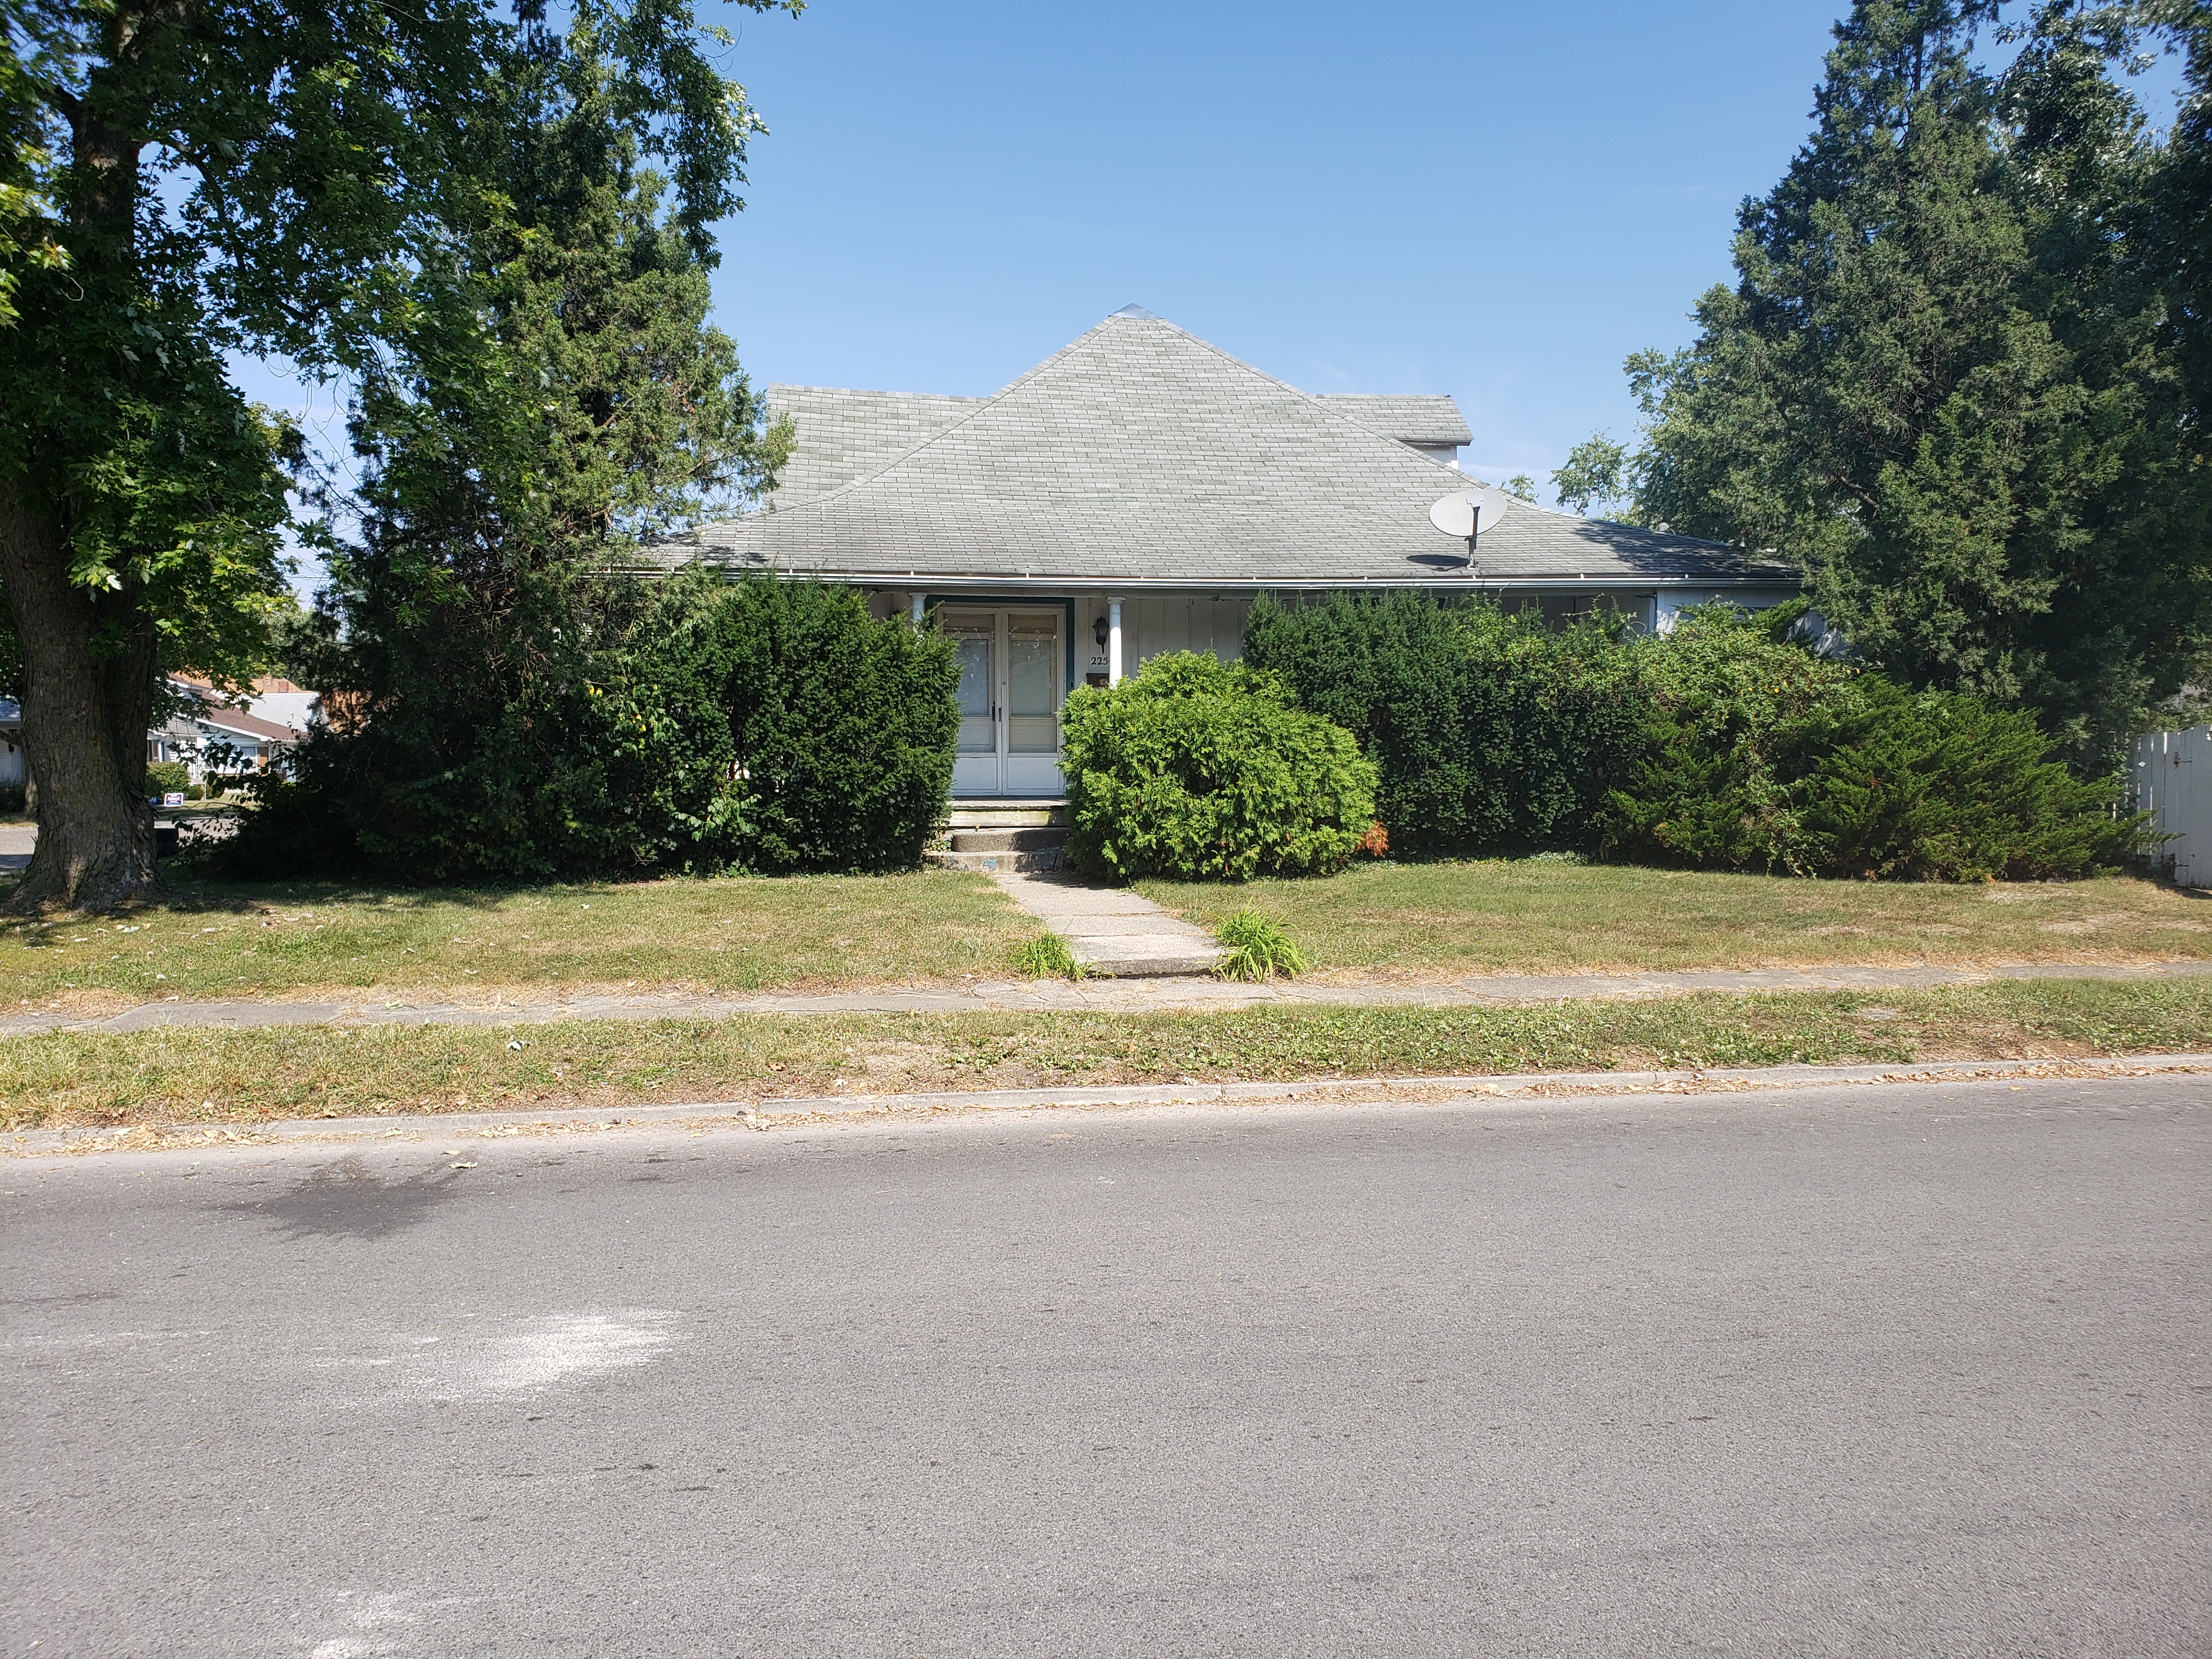


5 bedroom/2 bath
2250 Crawford Terre Haute, IN 47805
Far far away, behind the word mountains, far from the countries Vokalia and Consonantia, there live the blind texts.